- Direct payment (XMR)
- Multisig escrow (beta) (XMR)

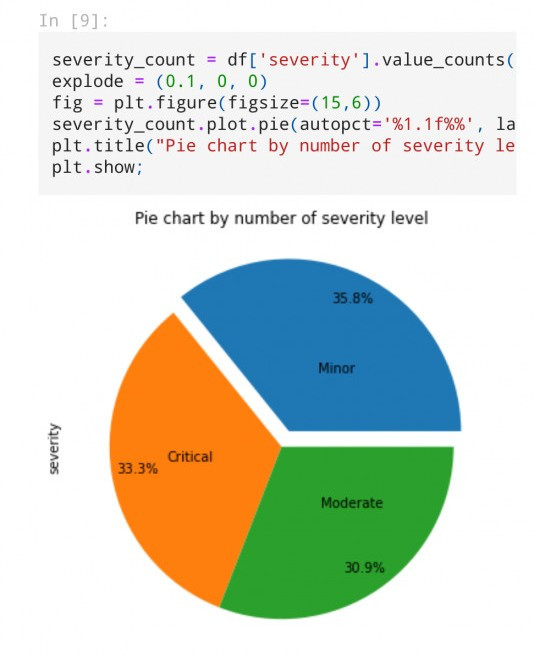
Data Visualization 
Description
I can use Tableau or jupyter notebook to generate graphs from your data(csv, tsv, txt, etc..). Which will help you better understand your data. You'll receive your tableau or notebook file which contain the graphs.
Category: IT
Tags: AI Visualization Python Tableau
Published on: November 10, 2024
Views: 9
Legal Notice: Buyers and sellers are responsible for complying with all applicable laws in their jurisdictions. XmrBazaar does not verify legality and assumes no liability. Peer-to-peer cash-for-crypto trades are permitted if not conducted as a business and are compliant with local laws; otherwise, sellers must hold any required licenses or registrations. Listings involving fraud, violence, child exploitation, or other clearly illegal goods or services are strictly prohibited and will be removed once identified. Users are encouraged to report unlawful listings.
About the trader
N/A
N/A
-----BEGIN PGP PUBLIC KEY BLOCK-----

mDMEAAAAABYJKwYBBAHaRw8BAQdADveJ/E6S0gyW78PLkQnOncSxDOeGfTtpqVDy
LDpv3Uq0GHJpY2tvbWUxMjNAeG1yYmF6YWFyLmNvbYiUBBMWCgA8FiEEPN2zGWU1
xaaJCNTjUkA4m1zksosFAgAAAAACGwMFCwkIBwIDIgIBBhUKCQgLAgQWAgMBAh4H
AheAAAoJEFJAOJtc5LKL6jwBAPoPCMPi3fUQs4+VL3UUYQ2rQKTV2ngma4A2T1Mj
NDHwAPsFUlkoiZrxw1LrvjXiej11IPnmTrbxjGpWtmzU04Q6Dbg4BAAAAAASCisG
AQQBl1UBBQEBB0BWWIejXAqpdz/RSB5u609U3irZINEv8Le37Kve2o1bFwMBCAeI
eAQYFgoAIBYhBDzdsxllNcWmiQjU41JAOJtc5LKLBQIAAAAAAhsMAAoJEFJAOJtc
5LKL+zkA/ipuMQuuK9cmvz3ibwuu3ayvsQgmUGma4cSZZjovV1f9AP45D39CeB36
aGqkX72MMb3Qlr0oo2elBNs5SyCR8Ja9AA==
=NO0M
-----END PGP PUBLIC KEY BLOCK-----